Verify your savings
Confirm context-mode is actually keeping tokens out of your context window — with ctx stats, doctor, the status line, and Insight.
context-mode works quietly in the background, so the natural question is: is it actually saving me anything? Here is how to prove it, in under a minute.
See it in action
A real Claude Code run: context-mode catches a file scan, runs it in the sandbox
(Think in Code), and returns only the answer — the raw file bytes never reach the
window. Then ctx stats shows the result.

See it in one command
Type ctx stats to your agent (or run context-mode doctor in the terminal for
the setup view). ctx stats reports exactly how much context this session kept
out of the window:
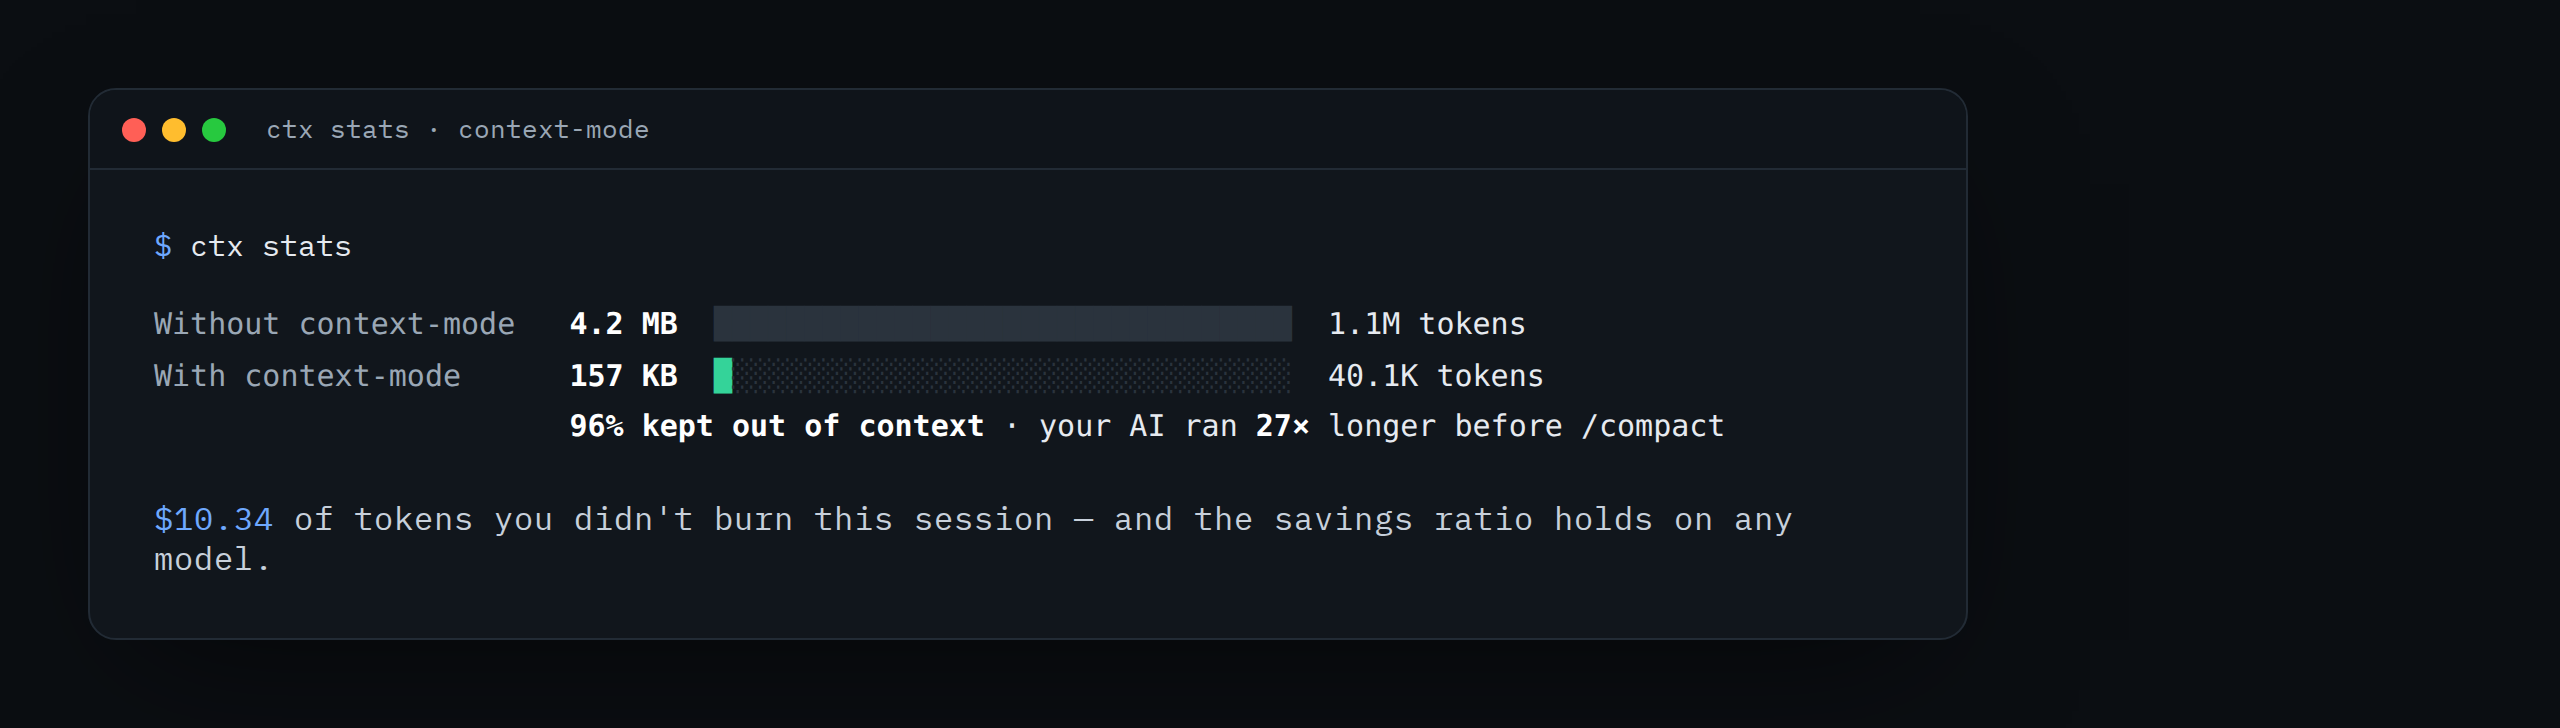
The two bars are the whole story: what your session would have cost without context-mode versus what actually reached the model. The percentage is the bytes processed in the sandbox divided by the bytes that entered context.
Prove it yourself (30-second test)
Note your starting point
Type ctx stats and remember the "kept out of context" figure.
Do something data-heavy
Ask your agent to analyze a large log, list 20 GitHub issues, or summarize a long build. Normally this floods the window with raw output.
Check again
Type ctx stats once more. The "kept out of context" number jumped — the raw
bytes were processed in the sandbox and never entered your conversation, while
you still got the answer.
Try it — multi-step prompts
The savings compound across a session, so the honest way to see them is a
multi-step run, not a single command. Try one of these, then run ctx stats:
Research https://github.com/modelcontextprotocol/servers — architecture, tech
stack, top contributors, open issues, and recent activity. Then run ctx stats.Create a local server that returns a 7.5 MB JSON with 20,000 records and a secret
hidden at index 13000. Fetch it, find the hidden record, and show me what is in it.
Then run ctx stats.Fetch the Hacker News front page, extract every post with its title, score, and
domain, and group by domain. Then run ctx stats.A single ctx_execute carries context-mode's fixed overhead with little to
amortize it against — a one-shot test can even look slightly pricier. A
multi-step session is where the kept-out bytes add up. See the
FAQ for why.
Confirm the plumbing
If the numbers look low, the routing hooks may not be firing. Run:
context-mode doctor
It checks the language runtimes, the FTS5 knowledge base, and that the hooks and
MCP server are registered for your host. If a host reports hooks not registered,
run context-mode upgrade to (re)write them.
No hooks on your host (MCP-only clients like Antigravity or Zed)? Routing is
advisory there, so confirm savings with ctx stats after a task rather than
expecting automatic interception.
Watch it live (Claude Code)
Claude Code can show savings in the status line in real time —
$ saved this session · $ saved across sessions · % efficient — so you see the
ratio climb as you work. See the Claude Code guide.
Team-level trends
For the cross-session, per-engineer view — productive rate, retry waste, blocker
detection — open the hosted dashboard with ctx insight.